
Nucleic acid and protein mass mapping by live-cell deep-UV microscopy
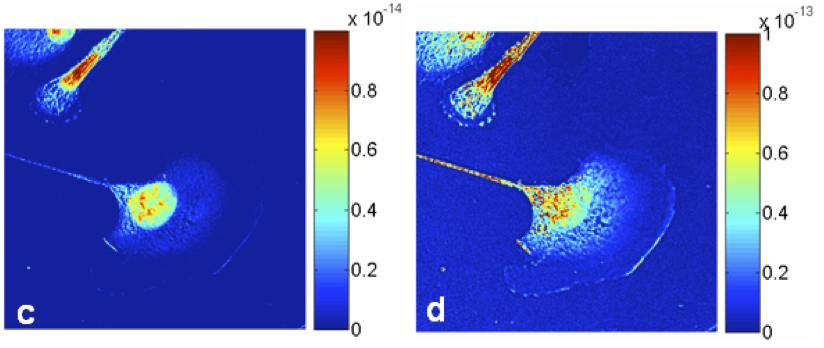
Quantification of nucleic acid and protein content in fixed and live cells
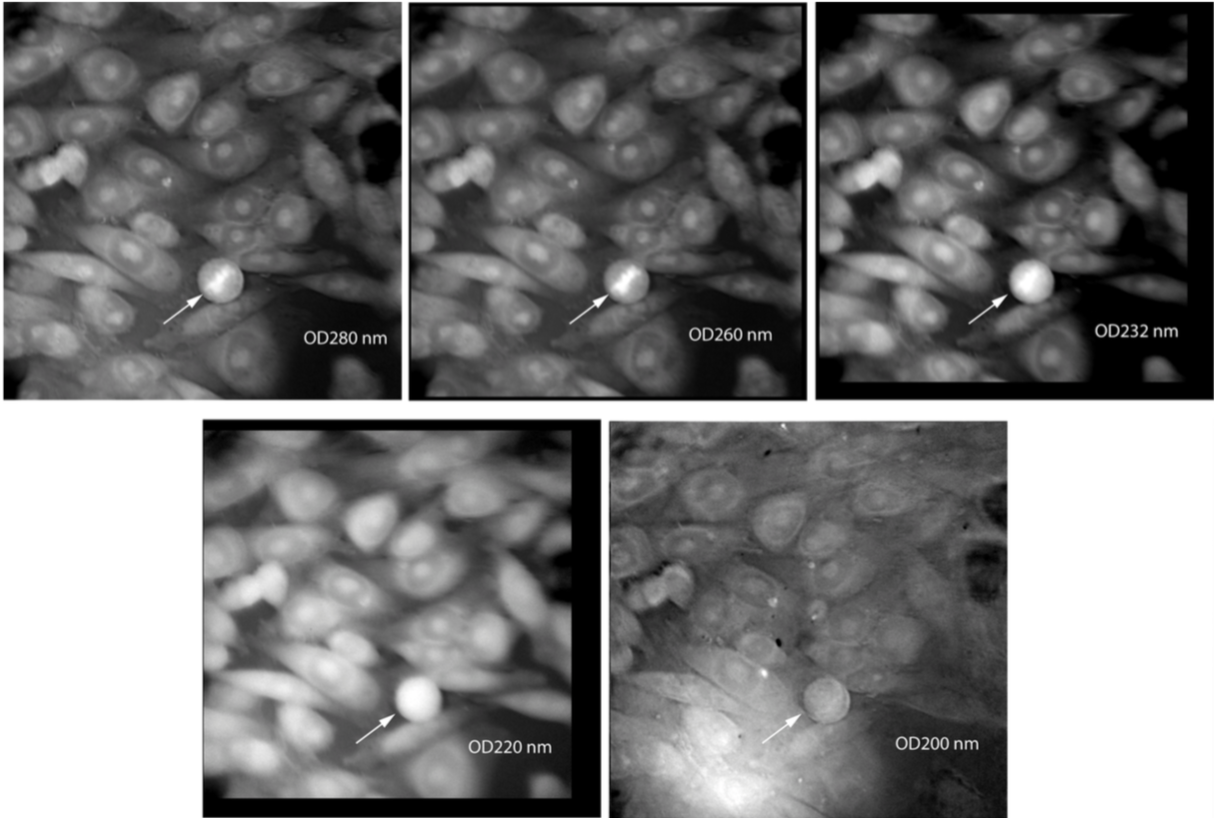
Background subtracted, raw optical density images
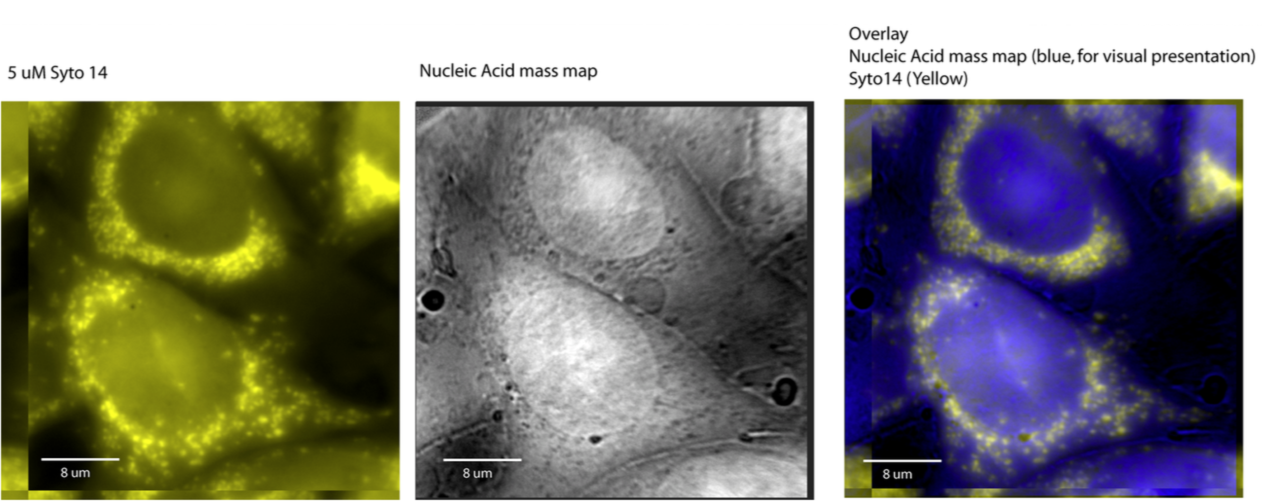
Nucleic acid and protein mass maps compared to nucleic acid stains
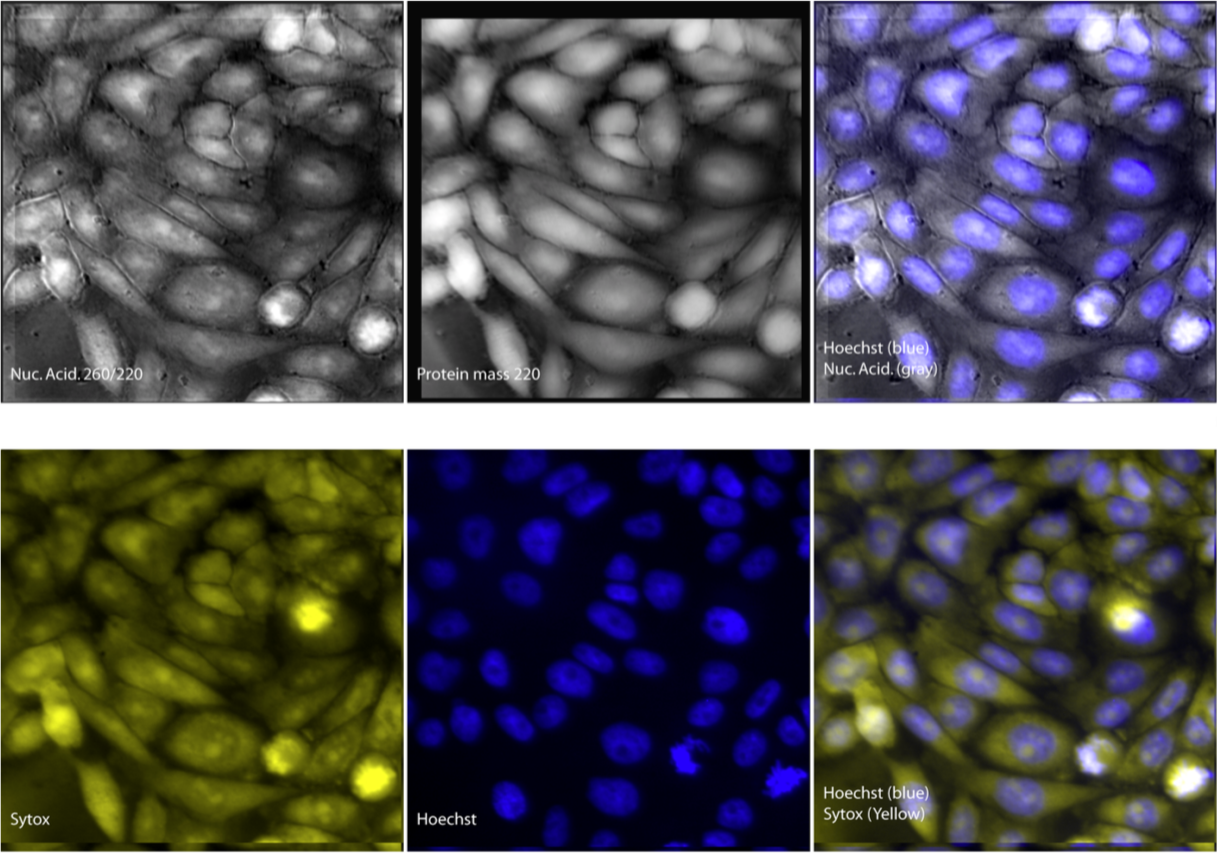
Distribution of protein and nucleic acid mass compared to nucleic acid dyes
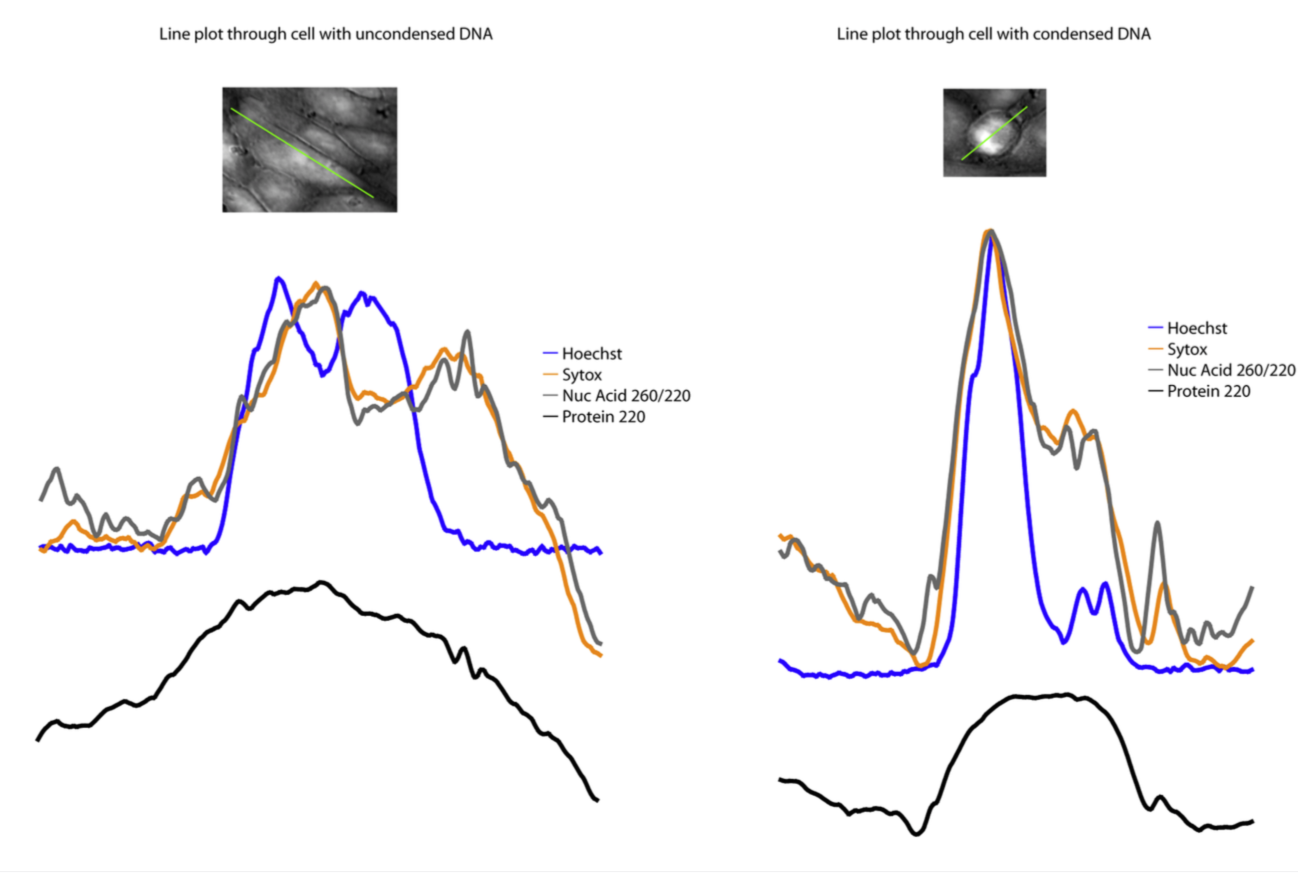
Mass maps can reveal details, comparable to staining, at 100x magnification
Cheung, MC, Evans,JG, McKenna, BK, and Ehrlich, DJ, Deep Ultraviolet Mapping of Intracellular Protein and Nucleic Acid in Femtograms per Pixel, Cytometry A, 79A, 920-932, 2011.
Zeskind BJ, Jordan CD, Timp W., Trapani L, Waller G, Horodincu V, Ehrlich DJ, and Matusudaira P: Nucleic acid and protein mass mapping by live-cell deep-ultraviolet microscopy. Nature Methods 4(7); 567-569, 2007.